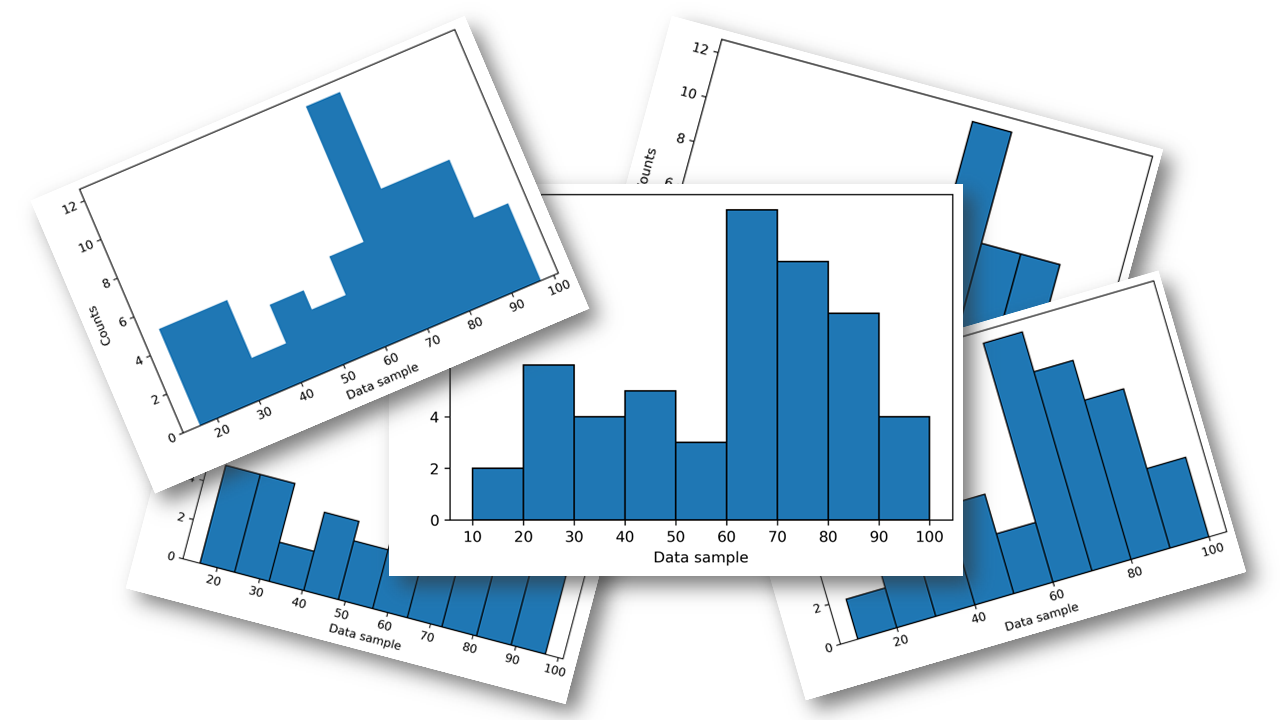
Back to the basics: the Matplotlib histogram#
We are all excited about exploring and developing new fancy plotting tools, but I want to take some time to revisit one of the basic plotting functions: Matplotlib’s histogram hist(), which relies on the NumPy histogram() function. Histograms are convenient to quickly inspect a dataset and get a feeling for the distribution of values that they contain.
I am often not satisfied with the default histograms produced by Matplotlib, requiring me to do repetitive manual adjustments. Here I will show how the histograms can be enhanced while avoiding time-consuming manual tweaking. I hope that these suggestions will be useful to others and ultimately that these will be adopted as the default plotting style for histograms in newer versions of Matplotlib.
Read more...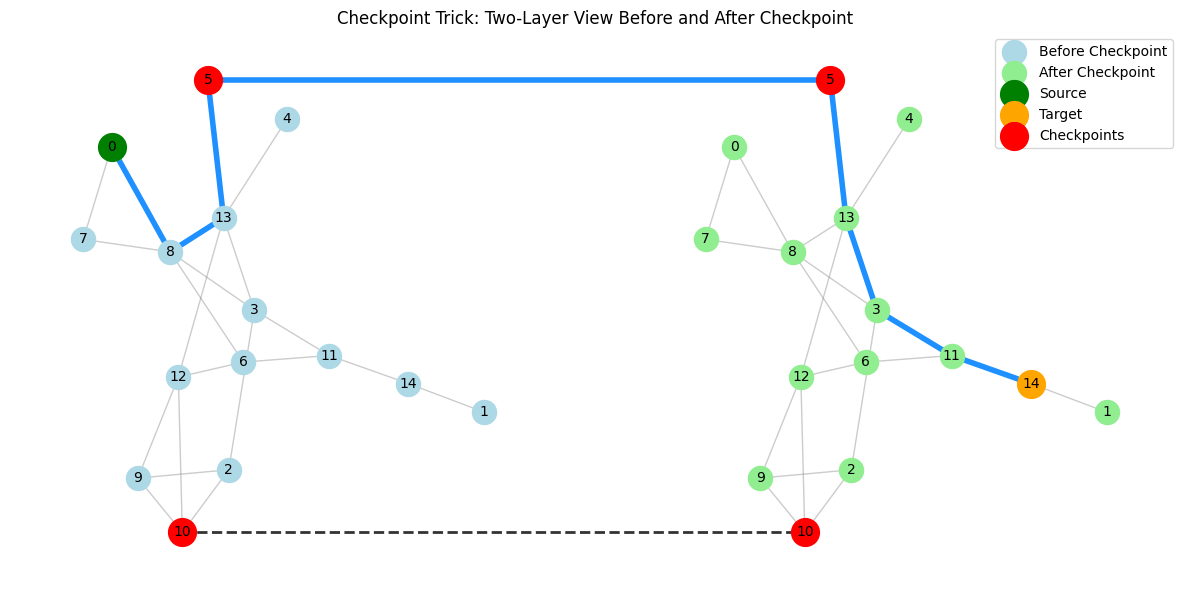 Many real-world shortest path problems include constraints that classic algorithms don’t directly handle. NetworkX provides robust, optimized implementations of algorithms like Dijkstra’s, Bellman-Ford, and A*. But what if your problem doesn’t fit the classic shortest path formulation?
 The 2024 Scientific Python Developer summit was held 3–5 June in Seattle. Here’s a summary of what we did.